In the global effort to reduce greenhouse gas emissions, understanding the lifecycle CO2 emissions of different electricity generation technologies is crucial. Below, we compare the CO2 emissions per kilowatt-hour (gCO2eq/kWh) for various technologies, based on UNECE 2020 data for EU28 countries.
Coal-Based Technologies
– Hard Coal, PC, without CCS: 1000 gCO2eq/kWh
– Hard Coal, SC, without CCS: 950 gCO2eq/kWh
– Hard Coal, IGCC, without CCS: 850 gCO2eq/kWh
– Hard Coal, PC, with CCS: 370 gCO2eq/kWh
– Hard Coal, SC, with CCS: 330 gCO2eq/kWh
– Hard Coal, IGCC, with CCS: 280 gCO2eq/kWh
Natural Gas Technologies
– Natural Gas, NGCC, without CCS: 430 gCO2eq/kWh
– Natural Gas, NGCC, with CCS: 130 gCO2eq/kWh
Renewable Energy Technologies
– Hydro (660 MW): 150 gCO2eq/kWh
– Hydro (360 MW): 11 gCO2eq/kWh
– CSP, trough: 42 gCO2eq/kWh
– CSP, tower: 22 gCO2eq/kWh
– PV, poly-Si, roof-mounted: 37 gCO2eq/kWh
– PV, poly-Si, ground-mounted: 37 gCO2eq/kWh
– PV, CdTe, roof-mounted: 15 gCO2eq/kWh
– PV, CdTe, ground-mounted: 12 gCO2eq/kWh
– PV, CIGS, roof-mounted: 14 gCO2eq/kWh
– PV, CIGS, ground-mounted: 11 gCO2eq/kWh
– Wind, offshore, concrete foundation: 14 gCO2eq/kWh
– Wind, offshore, steel foundation: 13 gCO2eq/kWh
– Wind, onshore: 12 gCO2eq/kWh
Nuclear Technology
– Nuclear (average): 5.1 gCO2eq/kWh
Conclusion
The data clearly indicates that renewable energy technologies and nuclear power are far superior to fossil fuels in terms of CO2 emissions. While CCS technology can mitigate some emissions from fossil fuel plants, the cleanest options remain wind, solar, hydro, and nuclear power. This analysis underscores the importance of transitioning to these low-emission technologies to combat climate change effectively.
Comparison Table of Lifecycle CO2 Emissions per kWh
| Technology | gCO2eq/kWh |
| Hard coal PC, no CCS | 1000.0 |
| Hard coal SC, no CCS | 950.0 |
| Hard coal IGCC, no CCS | 850.0 |
| Natural gas NGCC, no CCS | 430.0 |
| Hard coal PC, CCS | 370.0 |
| Hard coal SC, CCS | 330.0 |
| Hard coal IGCC, CCS | 280.0 |
| Hydro 660 MW | 150.0 |
| Natural gas NGCC, CCS | 130.0 |
| CSP trough | 42.0 |
| PV poly-Si roof | 37.0 |
| PV poly-Si ground | 37.0 |
| CSP tower | 22.0 |
| PV CdTe roof | 15.0 |
| Wind offshore concrete | 14.0 |
| PV CIGS roof | 14.0 |
| Wind offshore steel | 13.0 |
| Wind onshore | 12.0 |
| PV CdTe ground | 12.0 |
| PV CIGS ground | 11.0 |
| Hydro 360 MW | 11.0 |
| Nuclear | 5.1 |
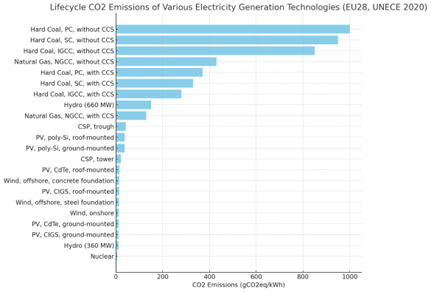
Comparison Bar Chart
The chart below provides a visual comparison of the lifecycle CO2 emissions per kWh for the various technologies: